框架:Flask

模型:使用线性回归,通过利率和前两个月的销售额来预测第三个月的销售额。

项目结构:

model.py – 包含机器学习模型的代码,用于根据前两个月的销售额预测第三个月的销售额。

app.py –- 包含用于从图形用户界面(GUI)或者API调用获得详细销售数据的Flask API,Flask API根据我们的模型计算预测值并返回。

request.py – 使用requests模块调用app.py中定义的API并显示返回值。

HTML/CSS – 包含HTML模板和CSS风格代码,允许用户输入销售细节并显示第三个月的预测值。

部署机器学习模型的Pipeline:

Scikit-learn Pandas Numpy Flask

构建前端

​ 使用HTML构建前端,让用户输入数据。这里有三个区域需要用户去填写——利率,第一个月的销售额,第二个月的销售额。接下来,使用CSS对输入按钮、登录按钮和背景进行了一些样式设置。

style.css

@import url(https://fonts.googleapis.com/css?family=Open+Sans);
.btn { display: inline-block; *display: inline; *zoom: 1; padding: 4px 10px 4px; margin-bottom: 0; font-size: 13px; line-height: 18px; color: #333333; text-align: center;text-shadow: 0 1px 1px rgba(255, 255, 255, 0.75); vertical-align: middle; background-color: #f5f5f5; background-image: -moz-linear-gradient(top, #ffffff, #e6e6e6); background-image: -ms-linear-gradient(top, #ffffff, #e6e6e6); background-image: -webkit-gradient(linear, 0 0, 0 100%, from(#ffffff), to(#e6e6e6)); background-image: -webkit-linear-gradient(top, #ffffff, #e6e6e6); background-image: -o-linear-gradient(top, #ffffff, #e6e6e6); background-image: linear-gradient(top, #ffffff, #e6e6e6); background-repeat: repeat-x; filter: progid:dximagetransform.microsoft.gradient(startColorstr=#ffffff, endColorstr=#e6e6e6, GradientType=0); border-color: #e6e6e6 #e6e6e6 #e6e6e6; border-color: rgba(0, 0, 0, 0.1) rgba(0, 0, 0, 0.1) rgba(0, 0, 0, 0.25); border: 1px solid #e6e6e6; -webkit-border-radius: 4px; -moz-border-radius: 4px; border-radius: 4px; -webkit-box-shadow: inset 0 1px 0 rgba(255, 255, 255, 0.2), 0 1px 2px rgba(0, 0, 0, 0.05); -moz-box-shadow: inset 0 1px 0 rgba(255, 255, 255, 0.2), 0 1px 2px rgba(0, 0, 0, 0.05); box-shadow: inset 0 1px 0 rgba(255, 255, 255, 0.2), 0 1px 2px rgba(0, 0, 0, 0.05); cursor: pointer; *margin-left: .3em; }
.btn:hover, .btn:active, .btn.active, .btn.disabled, .btn[disabled] { background-color: #e6e6e6; }
.btn-large { padding: 9px 14px; font-size: 15px; line-height: normal; -webkit-border-radius: 5px; -moz-border-radius: 5px; border-radius: 5px; }
.btn:hover { color: #333333; text-decoration: none; background-color: #e6e6e6; background-position: 0 -15px; -webkit-transition: background-position 0.1s linear; -moz-transition: background-position 0.1s linear; -ms-transition: background-position 0.1s linear; -o-transition: background-position 0.1s linear; transition: background-position 0.1s linear; }
.btn-primary, .btn-primary:hover { text-shadow: 0 -1px 0 rgba(0, 0, 0, 0.25); color: #ffffff; }
.btn-primary.active { color: rgba(255, 255, 255, 0.75); }
.btn-primary { background-color: #4a77d4; background-image: -moz-linear-gradient(top, #6eb6de, #4a77d4); background-image: -ms-linear-gradient(top, #6eb6de, #4a77d4); background-image: -webkit-gradient(linear, 0 0, 0 100%, from(#6eb6de), to(#4a77d4)); background-image: -webkit-linear-gradient(top, #6eb6de, #4a77d4); background-image: -o-linear-gradient(top, #6eb6de, #4a77d4); background-image: linear-gradient(top, #6eb6de, #4a77d4); background-repeat: repeat-x; filter: progid:dximagetransform.microsoft.gradient(startColorstr=#6eb6de, endColorstr=#4a77d4, GradientType=0); border: 1px solid #3762bc; text-shadow: 1px 1px 1px rgba(0,0,0,0.4); box-shadow: inset 0 1px 0 rgba(255, 255, 255, 0.2), 0 1px 2px rgba(0, 0, 0, 0.5); }
.btn-primary:hover, .btn-primary:active, .btn-primary.active, .btn-primary.disabled, .btn-primary[disabled] { filter: none; background-color: #4a77d4; }
.btn-block { width: 100%; display:block; }

* { -webkit-box-sizing:border-box; -moz-box-sizing:border-box; -ms-box-sizing:border-box; -o-box-sizing:border-box; box-sizing:border-box; }

html { width: 100%; height:100%; overflow:hidden; }

body {
width: 100%;
height:100%;
font-family: 'Helvetica';
background: #000;
color: #fff;
font-size: 24px;
text-align:center;
letter-spacing:1.4px;

}
.login {
position: absolute;
top: 40%;
left: 50%;
margin: -150px 0 0 -150px;
width:400px;
height:400px;
}

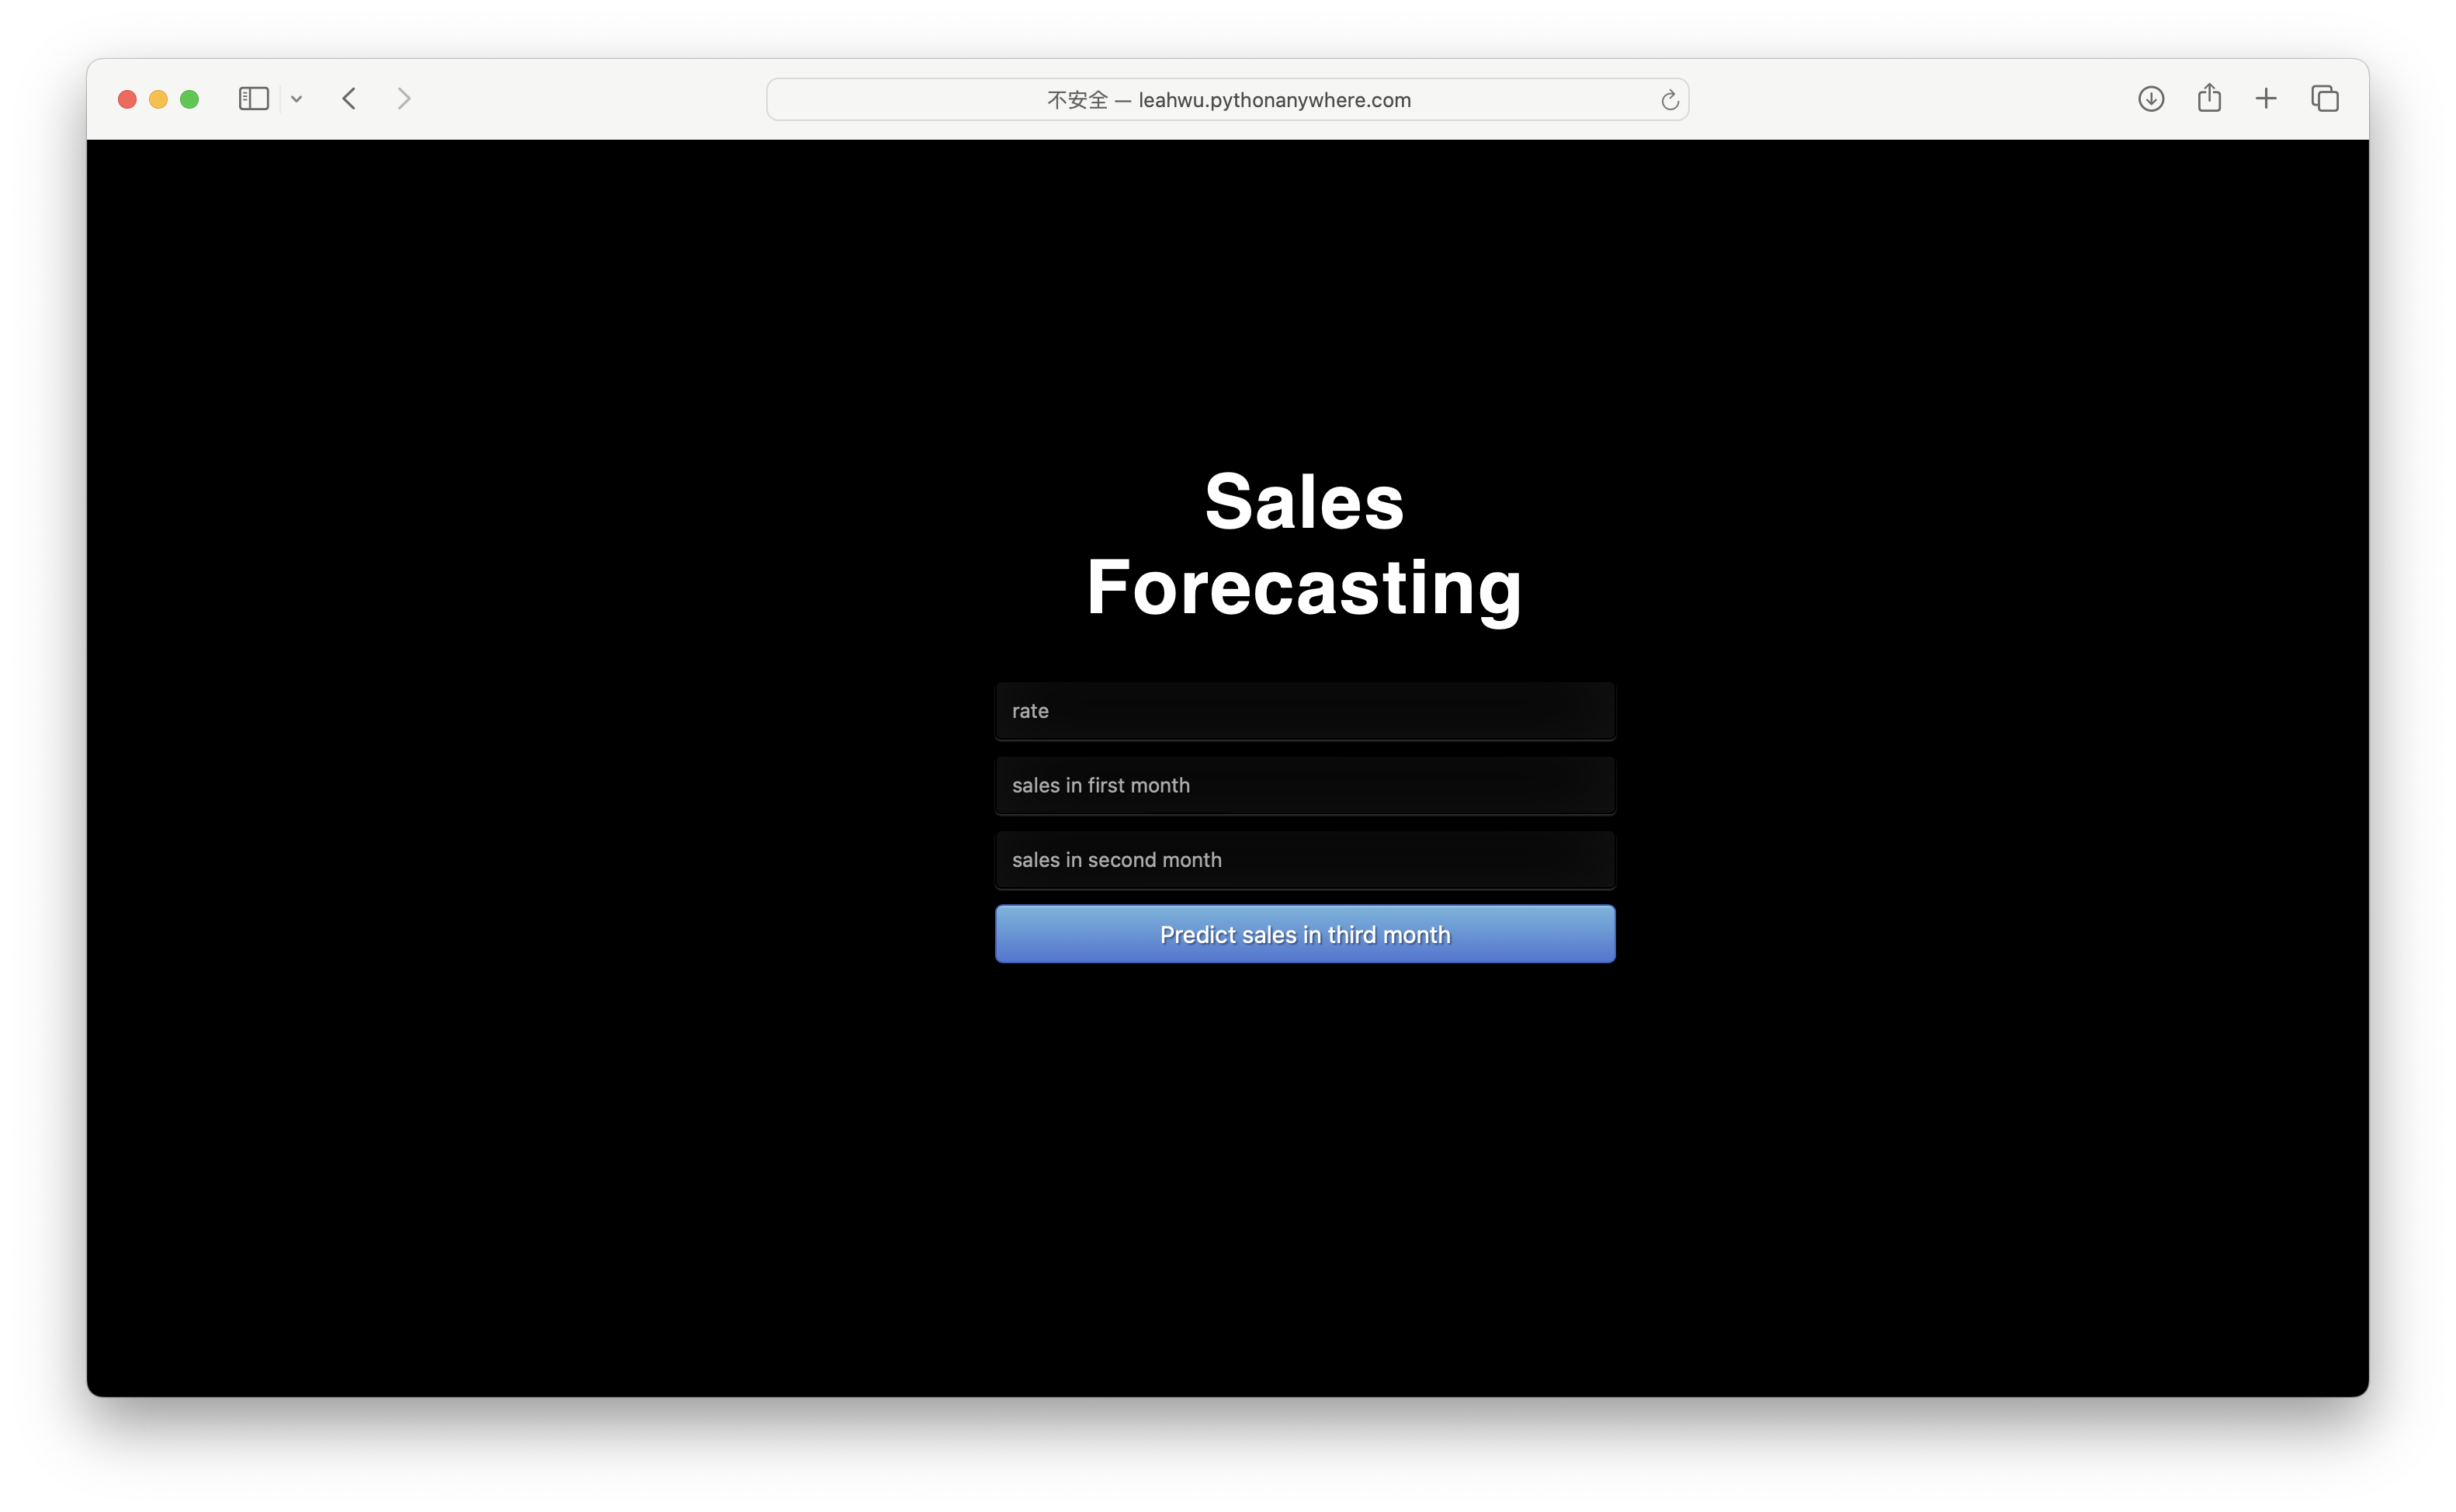
.login h1 { color: #fff; text-shadow: 0 0 10px rgba(0,0,0,0.3); letter-spacing:1px; text-align:center; }

input {
width: 100%;
margin-bottom: 10px;
background: rgba(0,0,0,0.3);
border: none;
outline: none;
padding: 10px;
font-size: 13px;
color: #fff;
text-shadow: 1px 1px 1px rgba(0,0,0,0.3);
border: 1px solid rgba(0,0,0,0.3);
border-radius: 4px;
box-shadow: inset 0 -5px 45px rgba(100,100,100,0.2), 0 1px 1px rgba(255,255,255,0.2);
-webkit-transition: box-shadow .5s ease;
-moz-transition: box-shadow .5s ease;
-o-transition: box-shadow .5s ease;
-ms-transition: box-shadow .5s ease;
transition: box-shadow .5s ease;
}
input:focus { box-shadow: inset 0 -5px 45px rgba(100,100,100,0.4), 0 1px 1px rgba(255,255,255,0.2); }

模型训练

​ 这个项目定制的销售数据集,它有四列——利率、第一个月的销售额、第二个月的销售额和第三个月的销售额。

sales_data

​ 构建一个机器学习模型来预测第三个月的销售额。首先使用Pandas解决缺失值问题,当一项或多项指标没有信息时,就会有缺失值发生。使用0填充利率这一列的缺失值,平均值填充第一个月销售额中的缺失值,采用线性回归的机器学习算法。

​ 使用Pickling将python对象形式的模型转为字符流形式,其思想是这个字符流中包含了在另一个python脚本中重建这个对象所需的所有信息。

训练模型并保存

import numpy as np
import matplotlib.pyplot as plt
import pandas as pd
import pickle

dataset = pd.read_csv('sales.csv')

#dataset['rate'].fillna(0, inplace=True)

#dataset['sales_in_first_month'].fillna(dataset['sales_in_first_month'].mean(), inplace=True)
dataset['rate'] = dataset['rate'].fillna(0)
dataset['sales_in_first_month'] = dataset['sales_in_first_month'].fillna(dataset['sales_in_first_month'].mean())

X = dataset.iloc[:, :3]

def convert_to_int(word):
word_dict = {'one':1, 'two':2, 'three':3, 'four':4, 'five':5, 'six':6, 'seven':7, 'eight':8,
'nine':9, 'ten':10, 'eleven':11, 'twelve':12, 'zero':0, 0: 0}
return word_dict[word]
X['rate'] = X['rate'].apply(lambda x : convert_to_int(x))
y = dataset.iloc[:, -1]

from sklearn.linear_model import LinearRegression
regressor = LinearRegression()

regressor.fit(X, y)

# 通过pickle的方式将模型持久化保存到硬盘中
# 请在这里输入代码 1
pickle.dump(regressor, open('model.pkl', 'wb'))

# 通过pickle的方式将硬盘中的模型加载进来进行测试
# 请在这里输入代码 2
model = pickle.load(open('model.pkl', 'rb'))

print(model.predict([[4, 300, 500]]))

主要注意sales.csv的路径问题。

构建API

构建一个API,反序列化这个模型为python对象格式,并通过图形用户界面(GUI)获取详细销售数据,根据模型计算预测值。使用index.html设置主页,并在使用POST请求方式提交表单数据时,获取预测的销售值。

可以通过另一个POST请求将结果发送给results并展示出来。它接收JSON格式的输入,并使用训练好的模型预测出可以被API端点接受的JSON格式的预测值。

index.html

<!DOCTYPE html>
<html >
<head>
<meta charset="UTF-8">
<title>Flask部署项目</title>
<link href='https://fonts.googleapis.com/css?family=Pacifico' rel='stylesheet' type='text/css'>
<link href='https://fonts.googleapis.com/css?family=Arimo' rel='stylesheet' type='text/css'>
<link href='https://fonts.googleapis.com/css?family=Hind:300' rel='stylesheet' type='text/css'>
<link href='https://fonts.googleapis.com/css?family=Open+Sans+Condensed:300' rel='stylesheet' type='text/css'>
<link rel="stylesheet" href="{{ url_for('static', filename='css/style.css') }}">

</head>

<body style="background: #000;">
<div class="login">
<h1>Sales Forecasting</h1>

<!-- Main Input For Receiving Query to our ML -->
<form action="{{ url_for('predict')}}"method="post">
<input type="text" name="rate" placeholder="rate" required="required" />
<input type="text" name="sales in first month" placeholder="sales in first month" required="required" />
<input type="text" name="sales in second month" placeholder="sales in second month" required="required" />


<button type="submit" class="btn btn-primary btn-block btn-large">Predict sales in third month</button>
</form>

<br>
<br>
{{ prediction_text }}

</div>


</body>
</html>

app.py

import numpy as np
from flask import Flask, request, jsonify, render_template
import pickle

app = Flask(__name__)
# 通过pickle的方式将硬盘中的模型加载进来进行测试
# 请在这里输入代码 2

model = pickle.load(open('model.pkl','rb'))

@app.route('/')
def home():
return render_template('index.html')

@app.route('/predict',methods=['POST'])
def predict():

int_features = [int(x) for x in request.form.values()]
final_features = [np.array(int_features)]
prediction = model.predict(final_features)

output = round(prediction[0], 2)

return render_template('index.html', prediction_text='Sales should be $ {}'.format(output))

@app.route('/results',methods=['POST'])
def results():

data = request.get_json(force=True)
prediction = model.predict([np.array(list(data.values()))])

output = prediction[0]
return jsonify(output)

if __name__ == "__main__":
app.run(debug=True)

使用requests模块调用在app.py中定义的APIs,它的结果是第三个月销售额的预测值。

requests.py

import requests

url = 'http://localhost:5000/results'
r = requests.post(url,json={'rate':5, 'sales_in_first_month':200, 'sales_in_second_month':400})

print(r.json())

部署

安装Flask:

pip install flask

在该环境下的终端里进入app.py所在目录,执行下面的命令:

python app.py

在Web浏览器中打开http://127.0.1:5000/
将显示如下所示的GUI:

GUI

完成了本地部署。

云端模型部署

网址:https://www.pythonanywhere.com/

免费的账号只能建一个站。站名只能为XXX.pythonanywhere.com。其中XXX代表注册账户时所用的用户名。站点只能维持3个月,3个月后就会被删除。

省略注册账号步骤,登录之后可以看到该界面

进入Files:

在左侧逐级进到所需要的目录之后,Upload a file上传文件:

不能直接上传文件夹,所以如果要上传多份文件,可以上传一个压缩包,然后在该位置Open Bash console here,再使用unzip xxxxx.zip命令进行解压。

点击Web标签,找到“Add a new web app”

顺着流程设置,点击“Next”。选择“Flask”:

选择对应的Python版本

设置路径

默认路径会是xxxxx/flask_app.py,先不用改,会在该路径下自动创建一个flask_app.py文件。如果改成自己已经上传的文件,例如/home/leahwu/mysite/20240515/app.py,会创建一个新的app.py文件覆盖自己原来上传的app.py文件。所以这一步就先不用自己设置,按默认路径就行。

修改Source code,改成app.py所在的目录:


进入该目录,进入app.py文件,修改代码,改成这里对应的路径:

返回Web,打开WSGI configuration file

最后一行代码原来默认的是:

from flask_app import app as application # noqa

将最后一行代码改成:

from app import app as application # noqa

(from xxx import app 的xxx对应的就是要用的xxx.py)

Save,Reload:

进入

完成了云端部署。